Visualizing the italian entertainment industry
LaLettura, Corriere della Sera
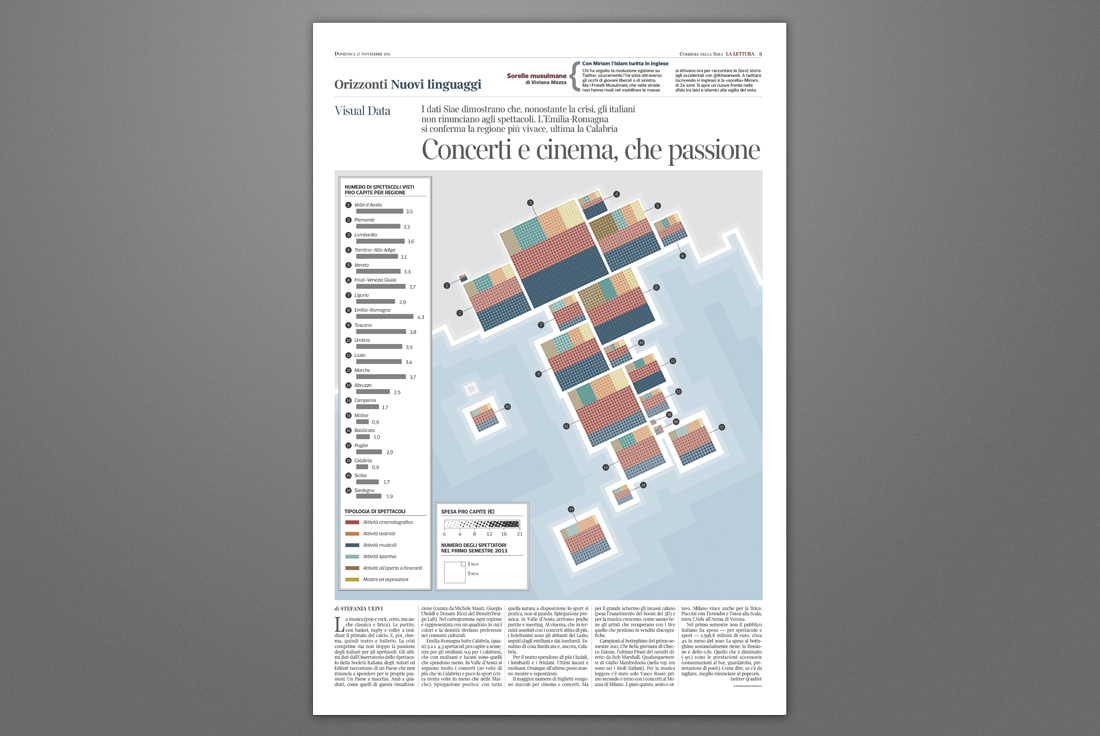
The exploration of the entertainment industry can reveal many socio-cultural aspects of a country.
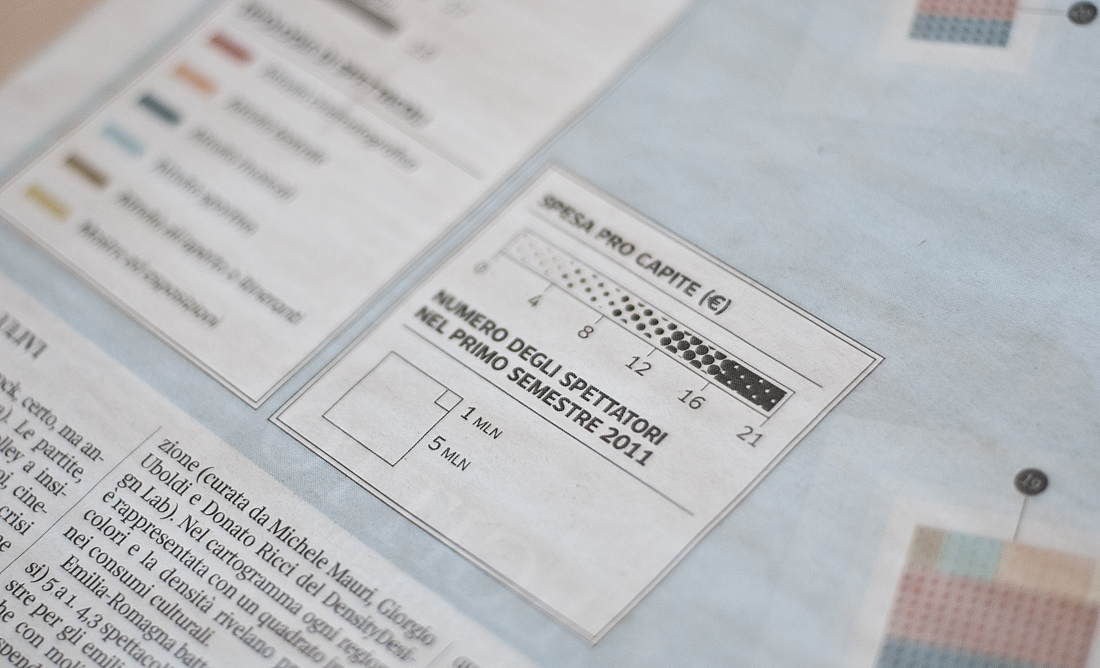
In this visualization for LaLettura we designed a cartogram of Italy where the size of the regions is based on the number of tickets sold in the last six months, the divisions of the treemaps show the different types of entertainment (e.g., cinema, sports, theatre) and the density of the patterns the economic impact of each activity.
The final result is a visual representation that reflects in some way the econimic and cultural differences within our country and gives a different tool to probe the italian entertainment industry.