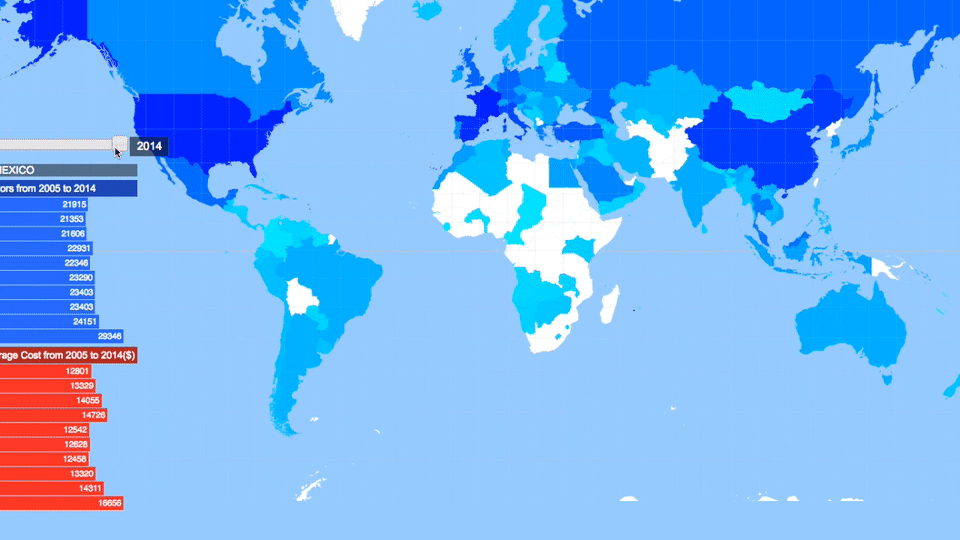
It is a data visualization project with d3. I demonstrate how popular and how expensive for travellers towards different countries. Hover on the country to check the number of visitors and history, move the slider to adjust the year from 2005 to 2014 to see the changes.
Please try on: http://www.yuebaixu.com/worldmaptraveller/worldmap/
Any comment is appreciated!