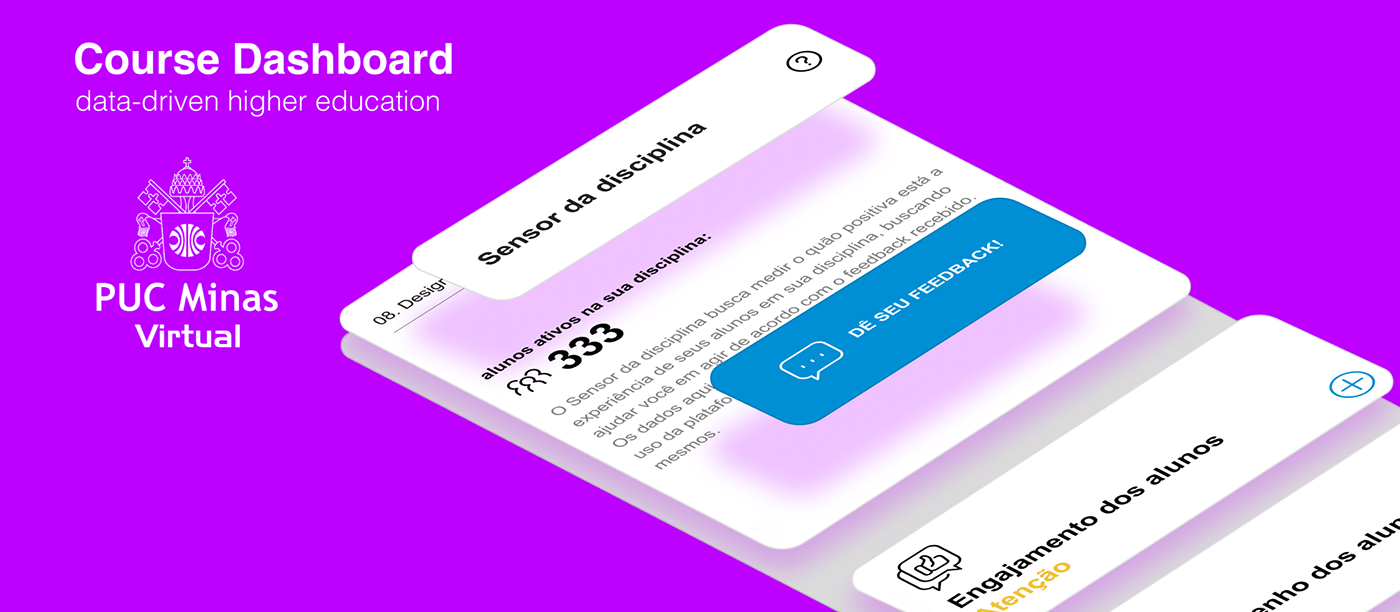
Data-driven decision making for everyone
"Sensor da Disciplina" (Course Dashboard), a tool for higher education teachers, lecturers and professors.
The challenge
Rethink the way teachers evaluate and improve their own courses to improve students' experience and learning.
The solution
A self-diagnosis tool that gives more autonomy, security and improvement capacity for teachers in distance education, making data accessible to all: from the strategic to the tactical and operational end.
Education has hardly changed since the 19th century, still being subject to industrial teaching and learning paradigms. With the growth of new technologies and teaching modalities, new challenges arise: teachers have difficulty keeping up with their remote students, the lack of feedback from students and the institution becomes a reality and improving their own practices becomes a huge challenge.
With this problem in mind, the "Course Dashboard" was created, a data product that brings to the teachers the information they need the most for a better understanding of their students' journey and their own course. Created from research, feedback, tests and iteration, one of the biggest concerns of this project was to create a tool that is empathic, easy to understand and useful for higher education teachers. Its use was well received, being used by more than 1500 teachers/ lecturers/ professors and theirs more than 75 thousand students at PUC Minas, covering not only digital teaching, but also teachers in "Contingent Presential Regime" adopted due to the pandemic throughout 2020.
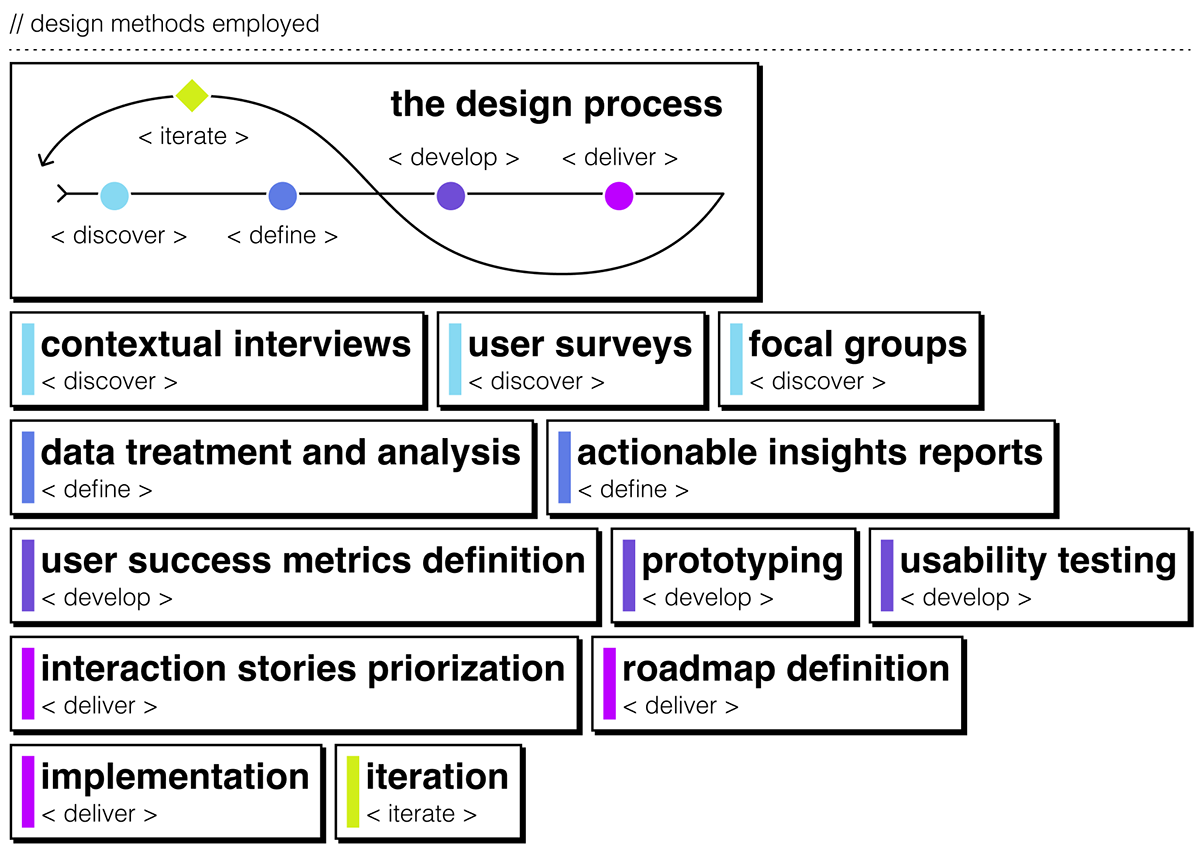
Design methods employed: // Contextual interviews: teachers, lecturers and professors (qualitative) // User Survey: teachers, lecturers and professors (quantitative) // Focal Groups: students (qualitative) // User Survey: students (quantitative) // Data treatment and analysis // Actionable insights reports // User success metrics definition: teachers, lecturers, professors and students // Prototyping (UX/ UI) // Usability testing // Interaction stories prioritization // Roadmap definition // Implementation // Project documentation // New findings communication: institution, teachers, lecturers and professors // Iteration.
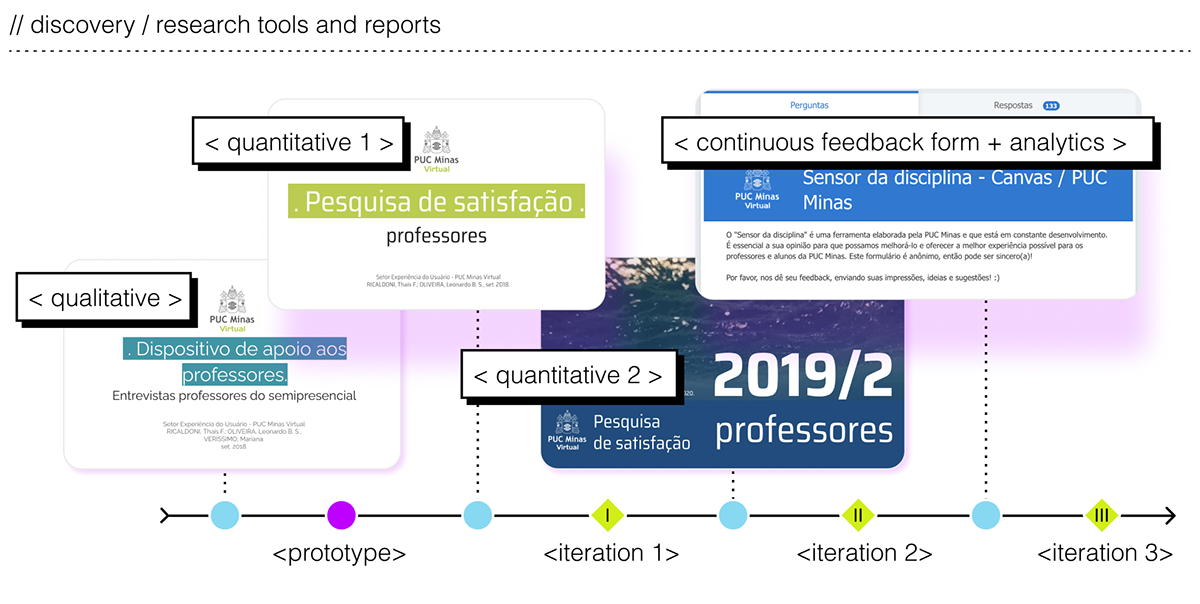
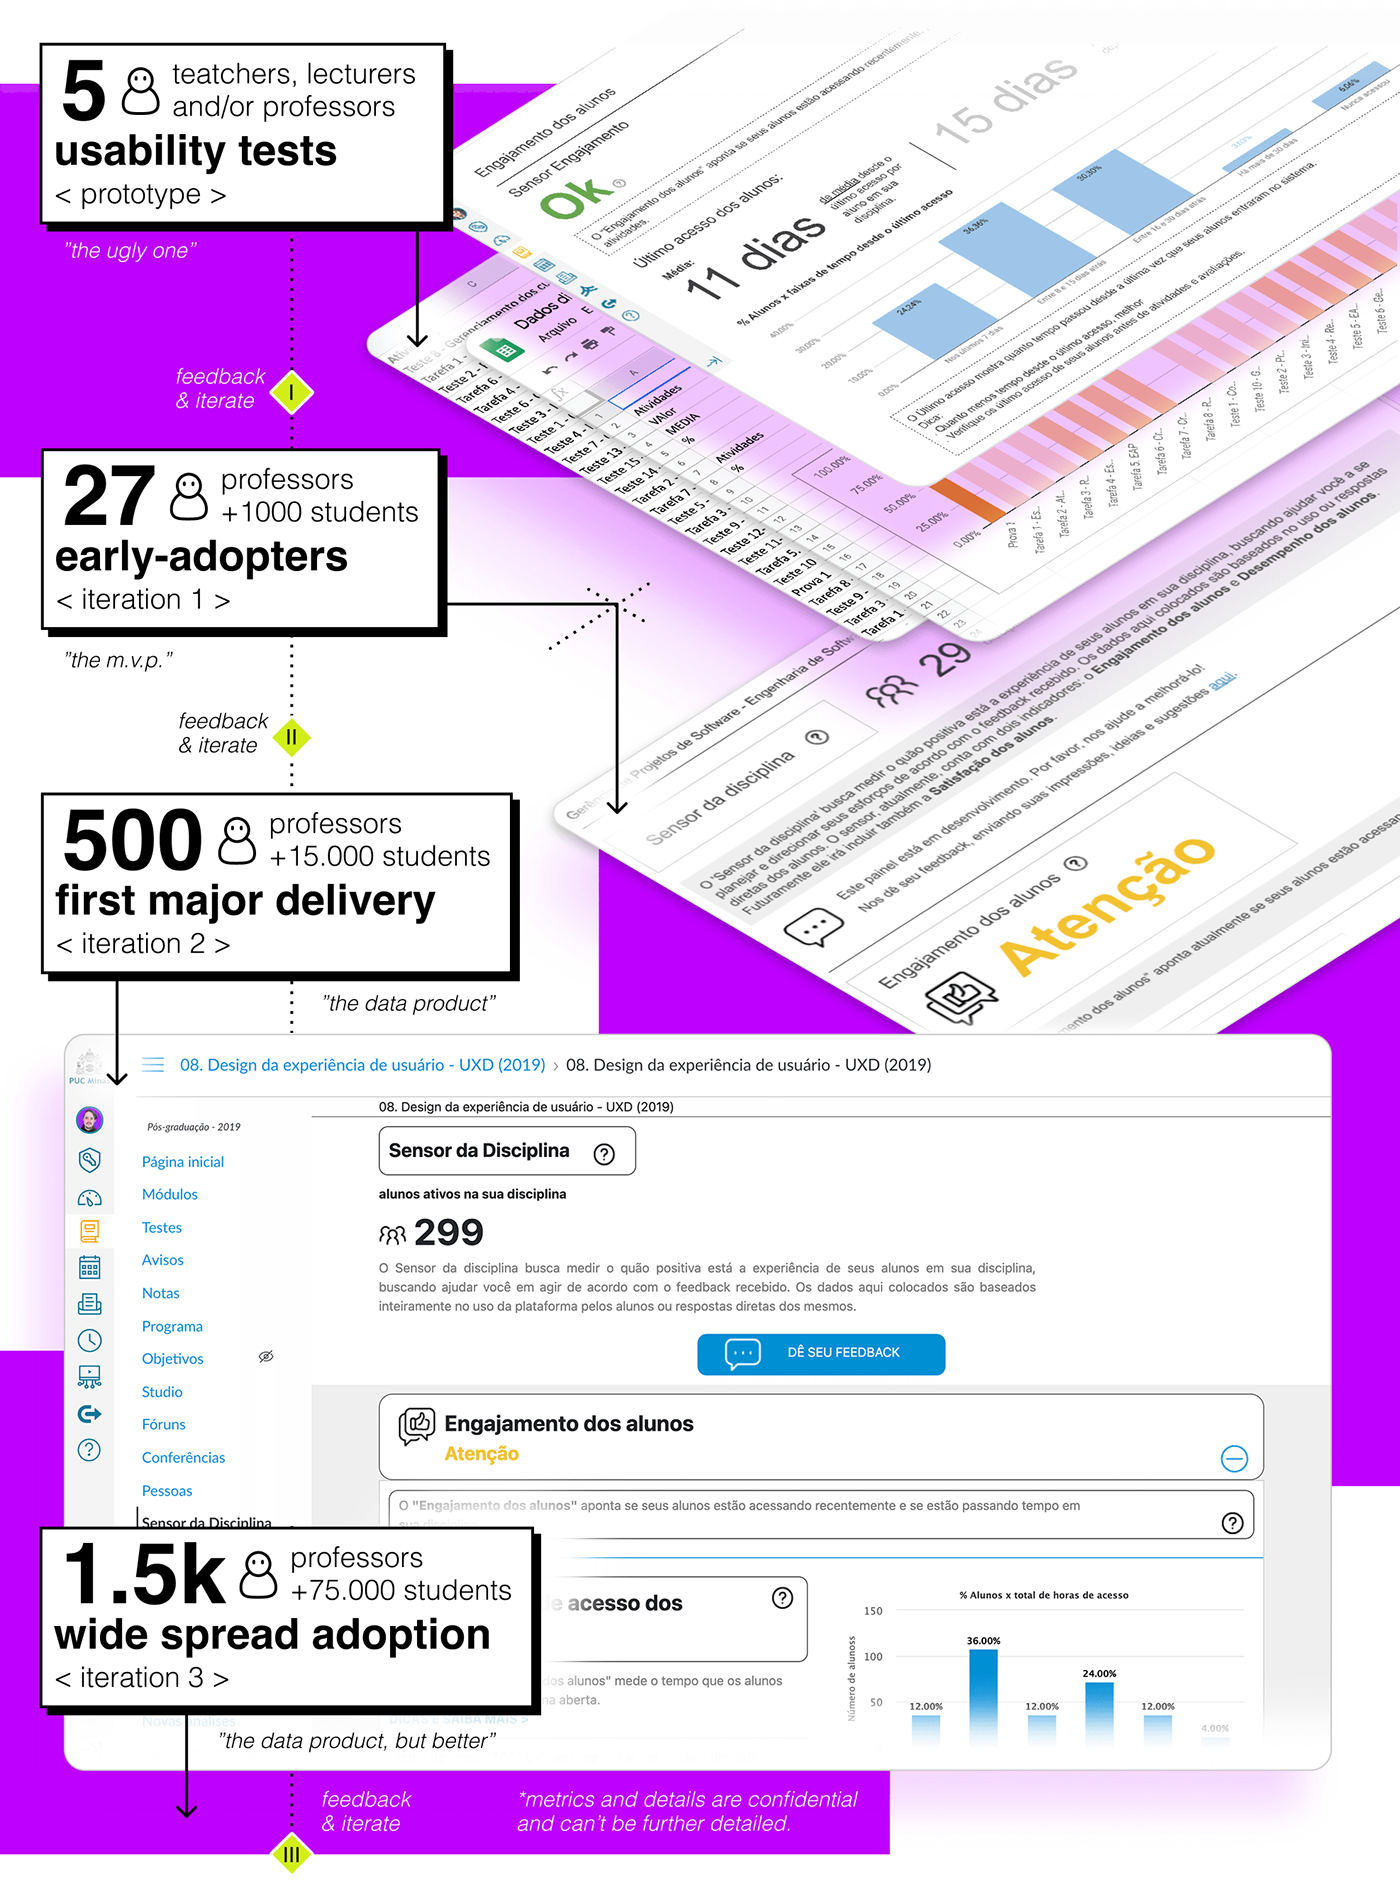
Project Iteration description: // 1 - Prototype and usability tests // 2 - Minimum Viable Product (M.V.P.) and early adopters // 3 - The Data Product and First Major Delivery // 4 - Current version and Wide Spread Adoption. As a data product, this project is of an iterative nature, being adjusted according to the new needs and positive impacts on the experience of teachers and students of the institution.
Video presentation of the "Course Dashboard" for teachers, lecturers and professors. This video is part of the teachers training in digital teaching.

Media and repercussion: This project and its development process was presented in various congresses and events. The most notable ones being: The Developers Conference BH 2020, The Developers Conference SP 2020 and UXTalk 2019. It was also the subject of an institutional publication, as of its relevance for the current strategies for making traditional higher education possible during the pandemic, in 2020.
Team:
Leonardo de Oliveira | Lead UX Designer
Thaís Falabella | UX Designer/ Researcher
Daniel Gamarano | UX Designer/ Researcher
Fábio Guimarães | Developer
Túlio Nogueira | Lead Developer